Python is often touted as having automatic memory management and therefore it’s not possible to leak memory. While the former is true, it’s still very possible to unintentionally hold onto memory you no longer need. In programs with a defined end, you can usually get away with it as Python will release it all back to the system at termination. But for long running servers even a very slow leak will eventually cause issues.
Recently one of my backend services starting triggering a monitoring alarm. Looking at the CPU and memory usage shows that something is pretty obviously wrong.
This is a containerised service running in ECS with Container Insights enabled which allows me to see useful metrics over time:
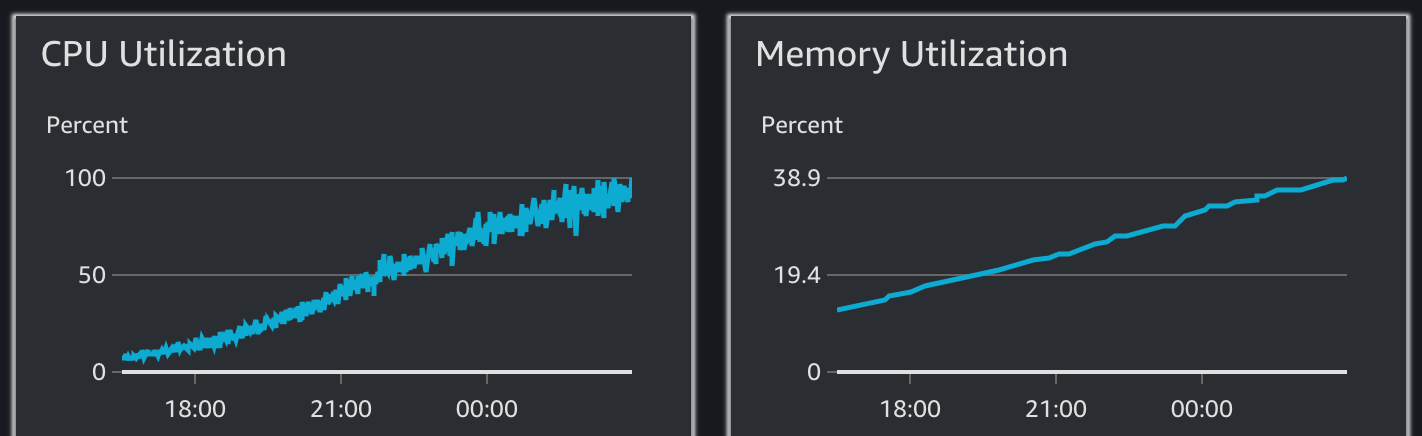
Cloudwatch Container Insights showing CPU/Memory usage of an ECS Task
This particular backend service has a very consistent and predictable fleet of connected devices, each of which maintains a single long-lived WebSocket connection to the server. Every device is pre-provisioned and so I knew this wasn’t caused by a sudden increase in client connections. A quick check of the incoming network traffic of the load balancer confirms the load had not changed.
Under normal conditions, I knew that historically both CPU and RAM usage hovered around 15%. In the space of around 11 hours, both metrics had climbed very steadily until the CPU hits 100%. Perhaps more worryingly, RAM usage steadily increases by 300%. Eventually it stops responding to health checks in time, and so ECS restarts the container and the reboot cycle starts again. In some ways that’s actually quite nice as it keeps the service somewhat working, but a forced restart every 12 hours is still quiet disruptive.
Just look
A (quick) first step is go through and find any obvious cases of memory allocations in long lived object instances. especially collections like lists and sets which can grow over time. If you consider which classes are the most used or the most important, sometimes you might spot something in the first few classes you look at without needing to break out the profiler.
In this case, I didn’t find anything obvious, at least in the files I looked at. It’s worth mentioning that you ensure the time spent doing this is strictly limited, as it’s easy for a few minutes to turn into a few hours just trawling through code.
Run a profiler
If you didn’t get very lucky by just looking at some suspect code, python has a couple of great options for profiling code. From the growing CPU usage, I didn’t want to rule out an inefficient block of code, so I used python’s cProfile to check how long the server spent in certain function calls.
It can be used with its run() function directly in your code, but I like to run it as a module and pass it the application code:
python -m cProfile [-o output_file] [-s sort_order] (-m module | myscript.py)
I ran the server with cProfile and created a handful of test clients that ran a predefined ’typical usage’ set of actions through its WebSocket. Nothing immediately jumped out in cProfile so I concluded that a particularly inefficient code path wasn’t the issue, and it was likely to indeed be a memory leak as initially suspected. I did also realise at this point that I didn’t have a way to do a load test locally which was truly representative of the production work load, so this isn’t completely conclusive.
Use tracemalloc
In the words of the python docs:
The tracemalloc module is a debug tool to trace memory blocks allocated by Python. It provides the following information:
- Traceback where an object was allocated
- Statistics on allocated memory blocks per filename and per line number: total size, number and average size of allocated memory blocks
- Compute the differences between two snapshots to detect memory leaks
Since I don’t have an easy way to accurately replicate a production load, I opted instead to add tracemalloc to the server. Its a FastAPI app, so I created a separate APIRouter that can be added to the existing app with app.include_router(tracemalloc_router).
I elected to use the environment variable PYTHONTRACEMALLOC to enable tracemalloc since it’s easy to do that on an ECS container. However, to control tracemalloc at runtime you could implement a specific route that looks something like this:
import tracemalloc
from fastapi import APIRouter, HTTPException, status

tracemalloc_router = APIRouter()

@tracemalloc_router.get("/debug/tracemalloc/{action}", summary="Start tracemalloc")
def tracemalloc_control(action: str):
    if action == "start":
        tracemalloc.start()
    elif action == "stop":
        tracemalloc.stop()
    else:
        raise HTTPException(
          status_code=status.HTTP_400_BAD_REQUEST,
          detail=f"Invalid action: {action}",
        )
This example obviously doesn’t include any auth, and of course you don’t want just anybody to be able to call this endpoint. So do ensure that you’re using an appropriate authn/authz mechanism to protect it.
Now that the app has runtime control over starting and stopping tracemalloc, I added another route that would take a memory snapshot and return the top 10 sources of memory allocations by source code line:
@tracemalloc_router.get("/debug/tracemalloc/snapshot", summary="Show top X memory allocations")
def tracemalloc_snapshot(count: int = 10):
    # Check for sensible input
    if 0 < count < 100:
        raise HTTPException(
            status_code=status.HTTP_400_BAD_REQUEST,
            detail="Count must be between 1 and 100",
        )

    snapshot = tracemalloc.take_snapshot()

    # Ignore <frozen importlib._bootstrap> and <unknown> files
    snapshot = snapshot.filter_traces(
        (
            tracemalloc.Filter(False, "<frozen importlib._bootstrap>"),
            tracemalloc.Filter(False, "<unknown>"),
        )
    )
    top_stats = snapshot.statistics("lineno")
    return {"stats": [str(stat) for stat in top_stats[:{count}]]}
Obviously this APIRouter is only needed for debugging purposes. But as long as these routes are appropriately protected, I don’t see why it can’t be included proactively as debugging tool in all backend apps, particularly for complex ones with many coroutines being created on a long running server.
After redeploying with the new routes, starting tracemalloc and waiting a while to see the memory usage had climbed, hitting this endpoint showed me where all that memory was going:
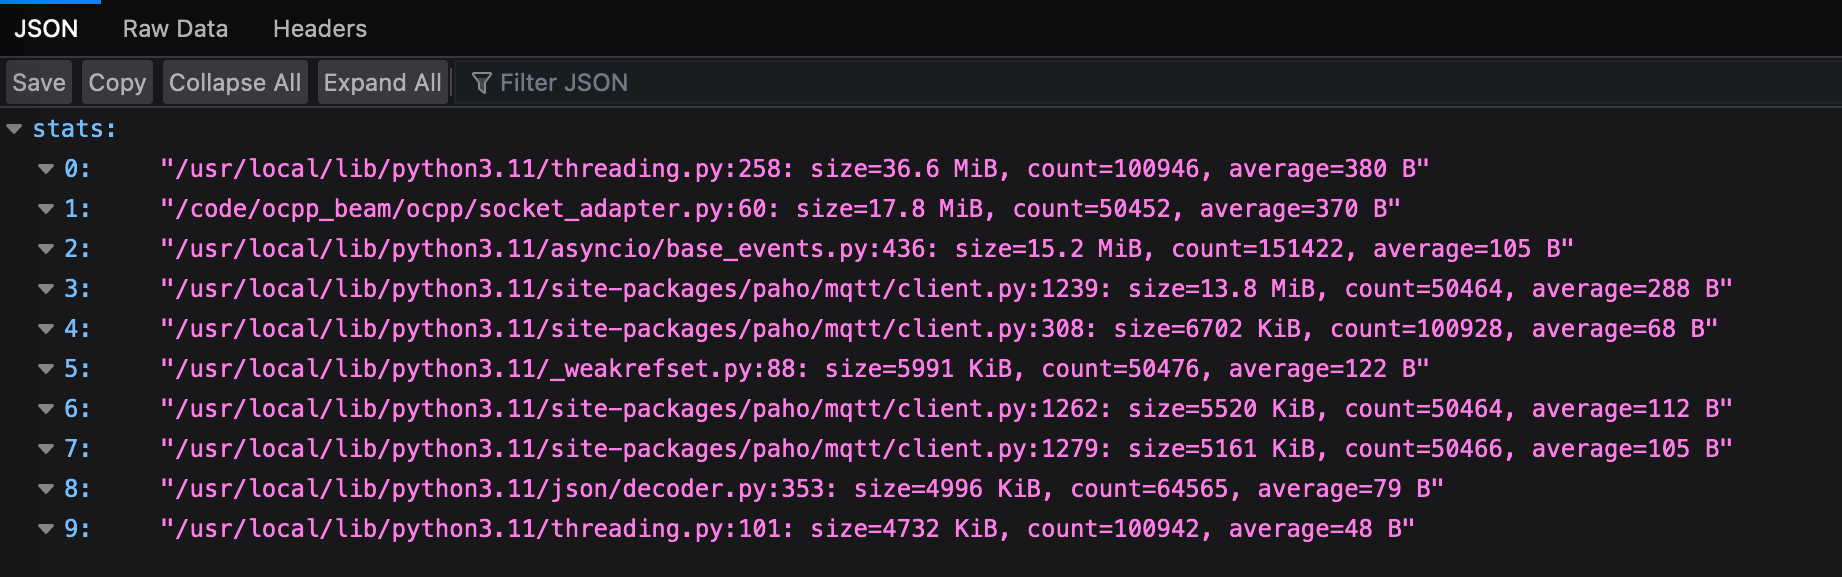
The only application code here is element 1, which very helpfully pointed me to the exact line which is allocating the memory.
Turns out it was a case of holding onto asyncio task references in order to cover this quirk of the asyncio API, where you must manually keep references to long running tasks retuned by calls to asyncio.create_task. This is required to avoid happily running coroutines being unexpectedly killed by the garbage collector since we no longer have a strong reference to their Task. But keeping those strong references now means you have to remember to remove them when the task is complete.
The recommended way to do this is to add a callback for every task with task.add_done_callback(taskset.discard). Easy enough, but also easy enough to forget, when many different components are independently adding background tasks to the event loop. If forgotten, then the task set stores every task ever created forever, until you run out of memory, or until it’s grown so large that adding a new task to the set takes a huge amount of CPU time.
This was the one usage of create_task out of many in the codebase that was missing the corresponding add_done_callback. Perhaps an improvement here would be to implement a wrapper TaskManager class around the asyncio create_task interface, which would serve as The One Way to schedule new tasks, and it would ensure that task references are tracked and removed when necessary, in one place.